Introduction
Tax rates, when applied to a property’s Equalized Assessed Value (EAV), determine how much a property owner pays in taxes. Tax rates often decline in reassessment years. Rates are recalculated each year and are affected by two things: the tax levy (the total property tax revenue sought by agencies to fund services), and the tax base (the total taxable value of property).
This means that reassessments can grow (or shrink) the tax base. When assessed values increase, the tax base can grow – causing the tax rate to fall.
This article demonstrates how to use PTAXSIM to:
- visualize previous tax rates in the North tri to show that, historically, tax rates typically decrease in reassessment years;
- apply percent changes to past-year tax levies and tax bases, to estimate new tax rates for every taxing district (e.g., each municipal, school, and county district); and
- produce estimated cumulative tax rates for every tax code in the North tri.
The impact of reassessments on tax rates
To begin, we will load some useful libraries and instantiate a
PTAXSIM database connection with the default name
(ptaxsim_db_conn) expected by PTAXSIM functions.
library(DBI)
library(data.table)
library(dplyr)
library(ggplot2)
library(ggspatial)
library(here)
library(httr)
library(jsonlite)
library(glue)
library(ptaxsim)
library(sf)
library(stringr)
library(tidyr)

ptaxsim_db_conn <- DBI::dbConnect(RSQLite::SQLite(), here("./ptaxsim.db"))
Gathering North tri tax codes
Since we’re interested in looking at tax rate history for the North
tri, we’ll first need to gather all tax codes that fall within North tri
townships for the years of interest. We can identify these tax codes and
their respective townships by querying the tax codes associated with all
North tri PINs from the Assessor’s
Office Open Data PIN Universe asset, filtering by fields
triad_code and year to select only North tri
PINs (triad code 2) and from tax years 2012 to 2023.
We can construct a query using the open data portal API, selecting
only the fields we’ll need: tax_code,
township_name, and year. Since we don’t need
each individual PIN for all of these years, we can omit pin
from the output and then remove all duplicates so we’re left with unique
tax codes, their townships, and year. (In some rare cases in Cook
County, a tax code can cover multiple townships, but in the North tri
each tax code is unique to a township.)
Some notes about tax codes: A tax code is a 5-digit number that identifies the unique combination of overlapping tax districts, such as city, school, and county districts, for a given area. All PINs in the same tax code pay taxes to the same unique combination of districts, and pay the same tax rate. It is possible for that combination of tax districts to change year over year (say, if a new SSA is created or a TIF expires) meaning a PIN’s tax code can change as well. This results in new tax codes being created over time, while others are retired. This necessitates querying the tax codes for each year of interest to ensure we have the entire universe of tax codes from 2012 to 2023.
# We can query the CCAO Open Data parcel universe to get all tax codes that fall
# within the north tri for each year of interest
base_url <- "https://datacatalog.cookcountyil.gov/resource/nj4t-kc8j.json"

north_tri_tax_codes <- data.frame(
  tax_code = character(),
  township_name = character(),
  year = character(),
  stringsAsFactors = FALSE
)

for (year in 2012:2023) {
  # Retry request in case of failure, since the Socrata API sometimes closes
  # connections unexpectedly
  response <- RETRY(
    "GET",
    base_url,
    query = list(
      year = year,
      triad_code = "2",
      `$select` = "tax_code, township_name, year",
      `$limit` = 500000L
    )
  )

  north_tri_all_rows <- fromJSON(rawToChar(response$content)) %>%
    as.data.frame() %>%
    unique()

  north_tri_tax_codes <- bind_rows(north_tri_tax_codes, north_tri_all_rows)
}
Now that we have all North tri tax codes from years 2012 to 2023, we can query the PTAXSIM database to find each of their tax rates for those years.
# Query the PTAXSIM database for tax code tax rates from 2012 to 2023 which are
# joined to our list of North tri tax codes
north_tri_tax_codes <- north_tri_tax_codes %>%
  mutate(
    year = as.integer(year)
  ) %>%
  inner_join(
    dbGetQuery(
      ptaxsim_db_conn,
      glue_sql("
      SELECT DISTINCT year, tax_code_num, tax_code_rate
      FROM tax_code
      WHERE year >= 2012
      AND year <= 2023
      ",
        .con = ptaxsim_db_conn
      )
    ),
    by = c("tax_code" = "tax_code_num", "year")
  )
Summarizing and visualizing tax rates over time
Next we’ll create a summary of the tax code rates by township and year, calculating the median, 25th and 75th percentile tax rates across all tax codes in each township for a given year. This will allow us to visualize the trends in tax rates through reassessment and non-reassessment years.
# Summarize and prepare data for plots
township_rate_summ <- north_tri_tax_codes %>%
group_by(township_name, year) %>%
summarize(
median_tax_rate = median(tax_code_rate),
perc_25_tax_rate = quantile(tax_code_rate, .25),
perc_75_tax_rate = quantile(tax_code_rate, .75)
) %>%
mutate(tax_rate_perc_change = (median_tax_rate - lag(median_tax_rate)) /
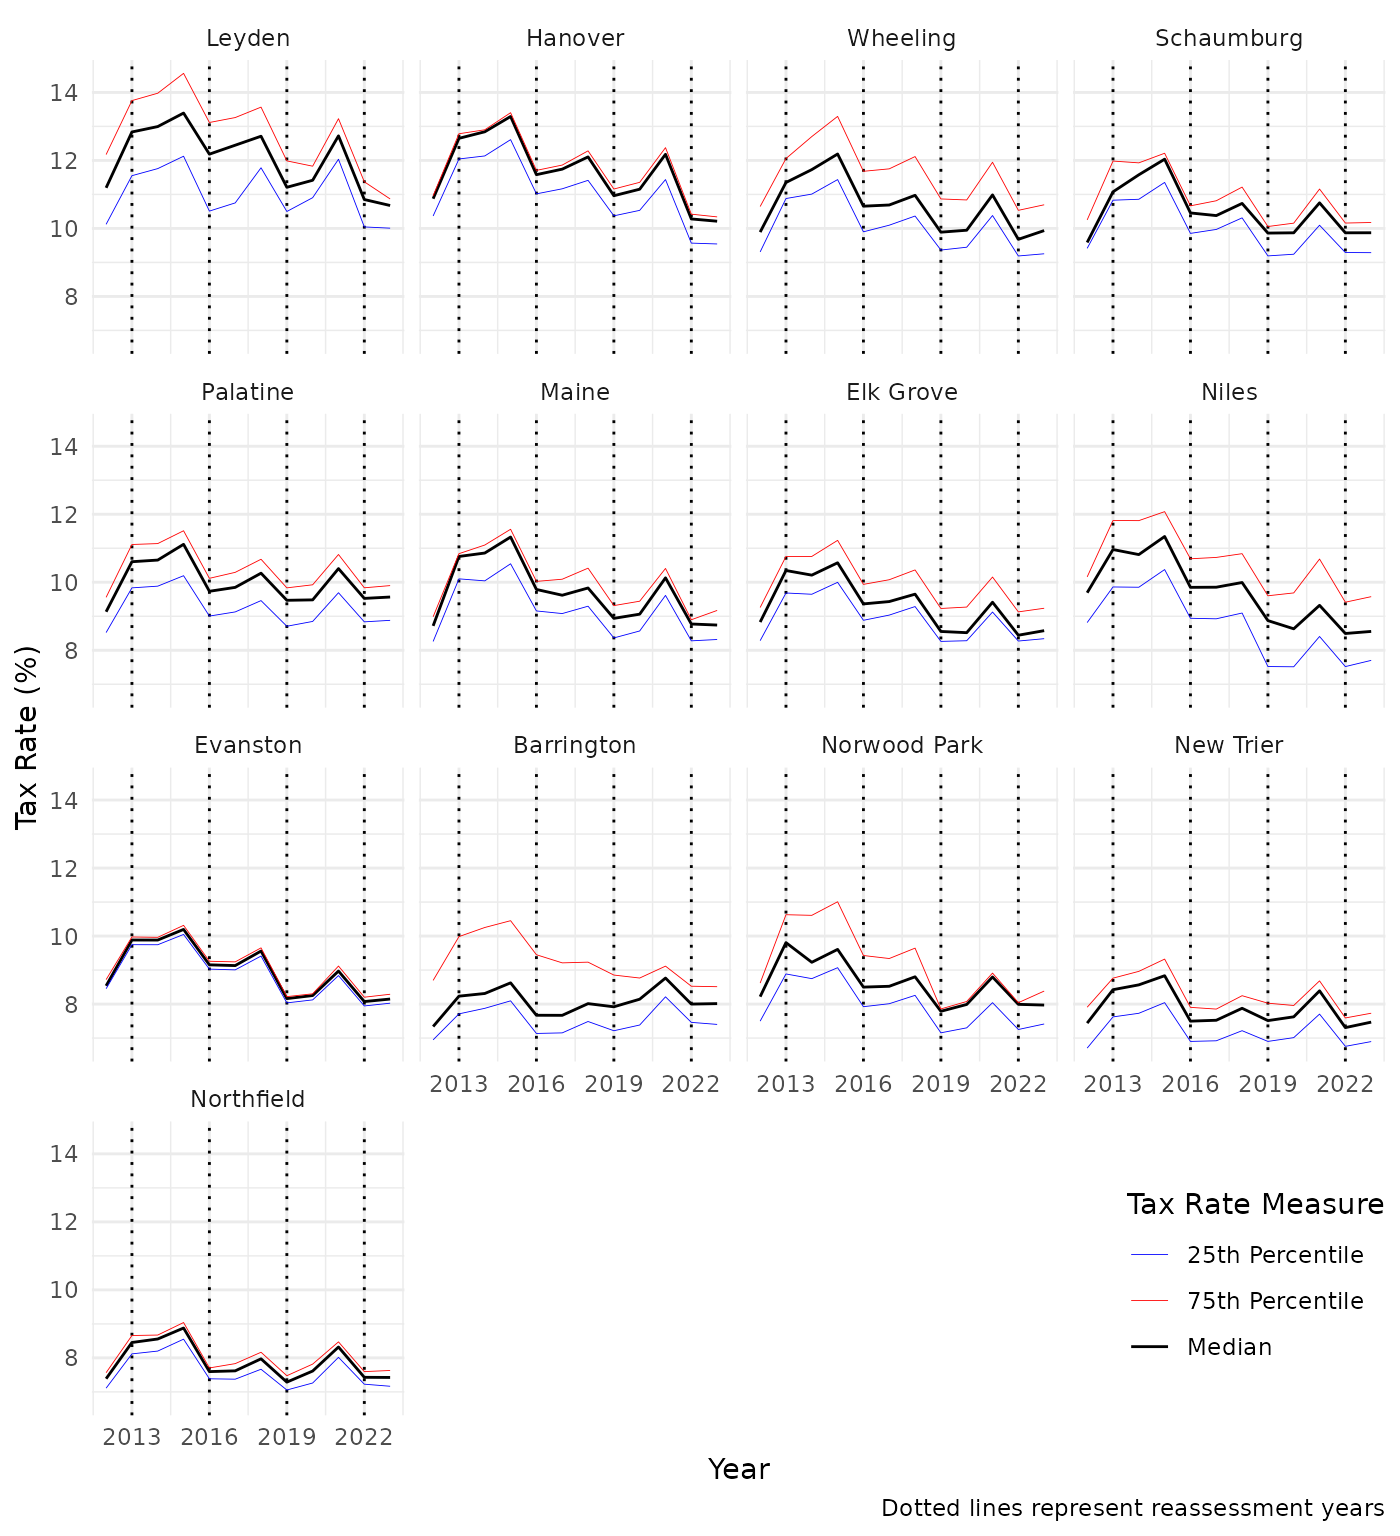
lag(median_tax_rate) * 100)The below visualization contains one graph per North tri township. Each graph shows tax rates: specifically, median, 25th percentile, and 75th percentile tax rates, per tax year. The dashed vertical lines mark the reassessment years of 2013, 2016, 2019, and 2022.
Tax rates can vary within a township, because townships are not the geographic region over which tax rates are calculated. Tax codes are. Evanston is unique in the North tri because tax rates are consistent throughout the township.
There is a clear historical trend: typically, tax rates decrease in reassessment years of 2016, 2019, and 2022. 2013 is an exception to this trend, when lower property values as a result of the Great Recession resulted in lower property assessments, a smaller tax base, and therefore higher tax rates.
Click here to show plot code
township_order <- township_rate_summ %>%
  filter(year == 2023) %>%
  arrange(desc(median_tax_rate))

township_order <- township_order$township_name
tax_rate_plot <- township_rate_summ %>%
  filter(!is.na(township_name)) %>%
  ggplot() +
  geom_vline(
    xintercept = c(2013, 2016, 2019, 2022),
    linetype = "dotted"
  ) +
  geom_line(
    aes(x = year, y = median_tax_rate, color = "Median"),
    linewidth = 0.5
  ) +
  geom_line(
    aes(x = year, y = perc_25_tax_rate, color = "25th Percentile"),
    linewidth = 0.15
  ) +
  geom_line(
    aes(x = year, y = perc_75_tax_rate, color = "75th Percentile"),
    linewidth = 0.15
  ) +
  scale_color_manual(
    name = "Tax Rate Measure",
    values = c(
      "Median" = "black",
      "25th Percentile" = "blue",
      "75th Percentile" = "red"
    )
  ) +
  scale_x_continuous(breaks = seq(2013, 2022, 3)) +
  facet_wrap(~ factor(township_name, township_order)) +
  labs(
    x = "Year",
    y = "Tax Rate (%)",
    caption = "Dotted lines represent reassessment years"
  ) +
  theme_minimal() +
  theme(
    legend.position = c(.9, .1)
  )
The plot below illustrates the percent change in the median tax rate for each township as compared to the prior tax year’s rates. Reassessment years 2016, 2019 and 2022 show a consistent pattern of tax rate decreases. In 2022 the median tax rate across the entire North tri was 9.06%, a 10.51% decrease from the median 2021 tax rate of 10.13%.
Click here to show plot code
perc_diff_plot <- township_rate_summ %>%
  filter(
    !is.na(township_name),
    !is.na(tax_rate_perc_change)
  ) %>%
  ggplot() +
  geom_vline(
    xintercept = c(2013, 2016, 2019, 2022),
    linetype = "dotted"
  ) +
  geom_hline(
    yintercept = 0
  ) +
  geom_col(
    aes(x = year, y = tax_rate_perc_change, fill = tax_rate_perc_change),
    width = 0.5,
    color = "black",
    linewidth = .2
  ) +
  scale_x_continuous(breaks = seq(2013, 2022, 3)) +
  facet_wrap(vars(township_name)) +
  scale_fill_distiller(palette = "RdBu", direction = 1) +
  labs(
    x = "Tax Year",
    y = "Tax Rate Percent Change (%)",
    caption = "Dotted lines represent reassessment years"
  ) +
  theme_minimal() +
  theme(legend.position = "none")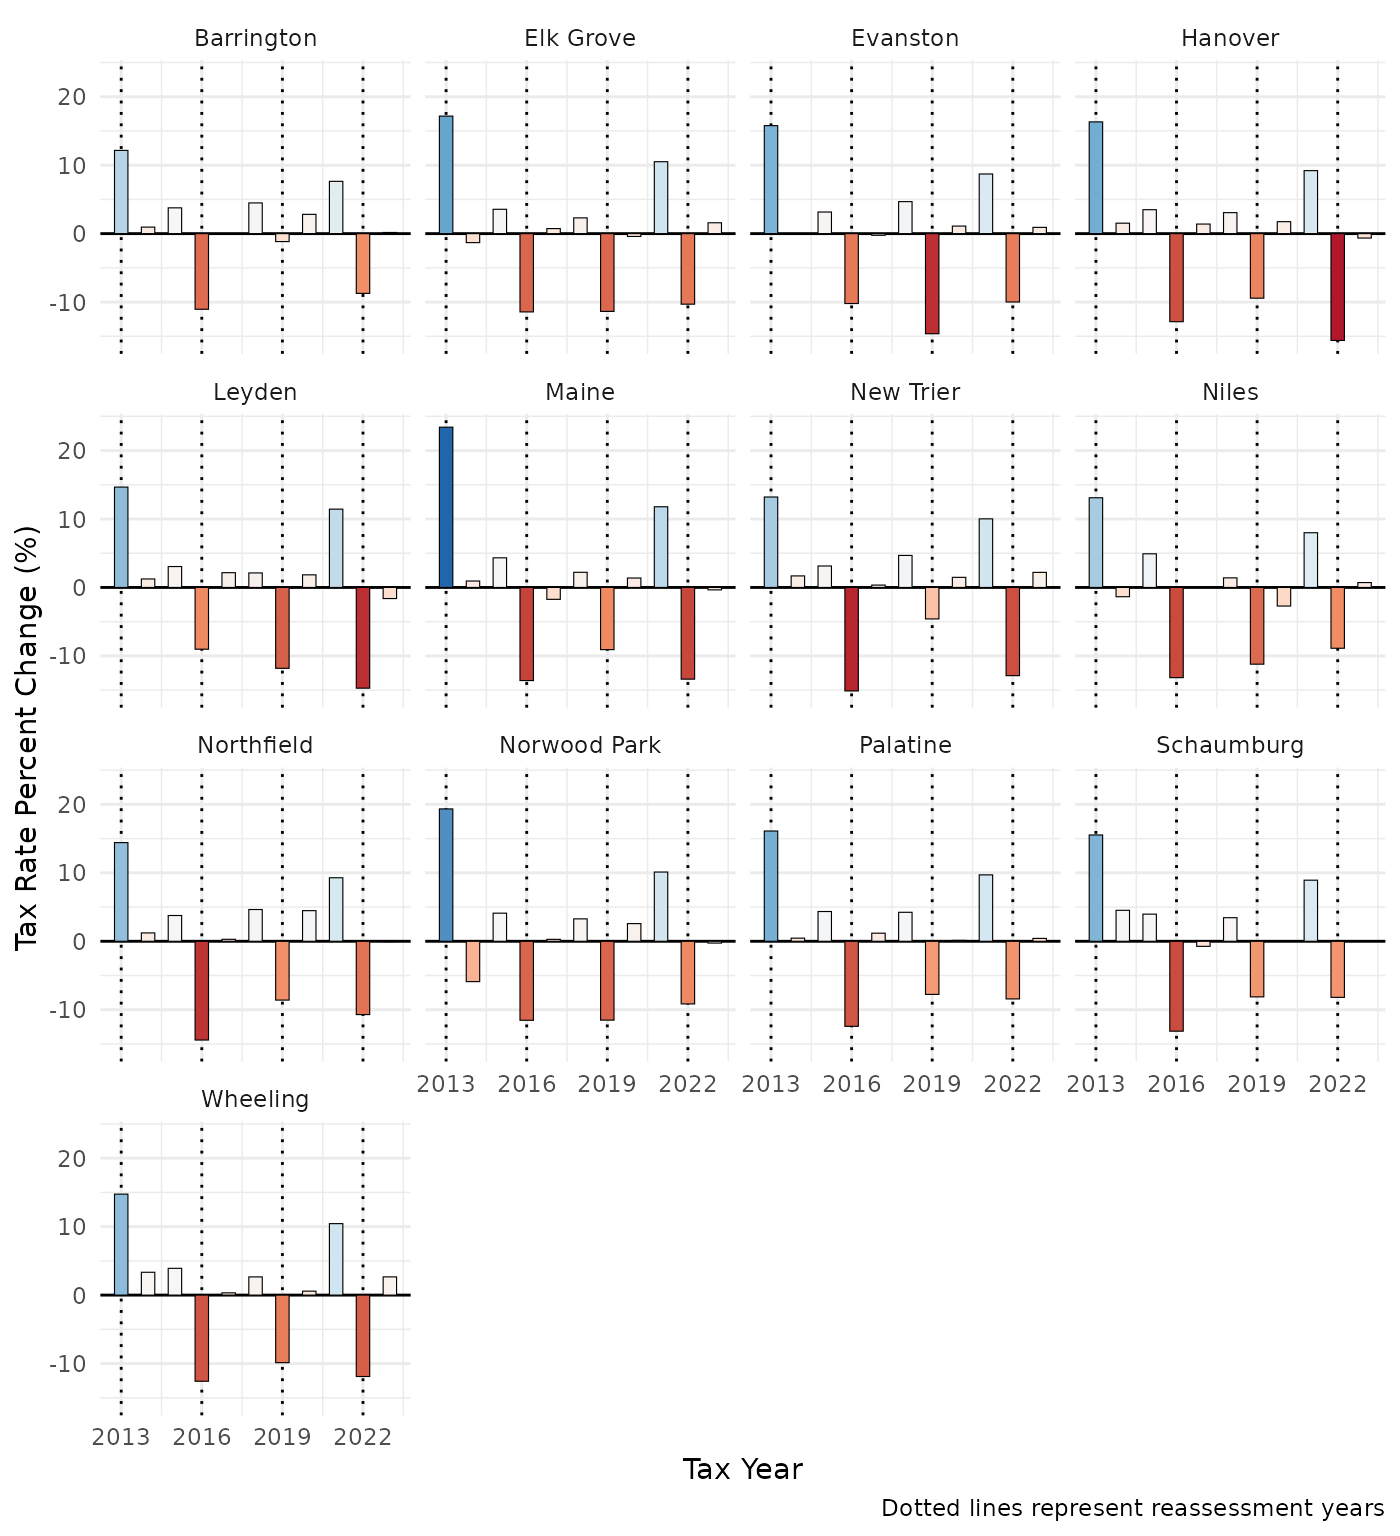
Estimating future tax rates
Methodology overview
In 2025, the CCAO is estimating local tax rates for Tax Year 2025, incorporating data-driven estimates of growth in the tax base, to use in its 2025 revaluation of income-producing property in Cook County’s North triad. As illustrated above, reassessment years consistently result in lower tax rates than the prior year’s when tax district levies do not exceed the growth of the tax base. This highlights the importance of using a method that accounts for anticipated growth of the tax base when estimating future rates, as opposed to using the prior year’s rates which would likely result in using higher tax rates that lead to an overestimate of commercial property tax expenses.
Estimating tax rates necessitates estimating the future tax base for all North tri taxing agencies, as well as the levy amount to be collected by these properties.
First, we need to calculate an estimated 2025 tax base for North tri agencies using ratio statistics. Ratio statistics are an analytical tool used to measure assessment performance by comparing assessed values to sale prices of sold properties. Specifically, the median ratio statistic quantifies whether assessments are typically close to 100% of the sale price of the property, or whether they are, for example, below sale prices (80%) or above sale prices (120%).
If, for example, a median sales ratio is 90%, then this indicates that for properties that have sold, their assessments are typically 10% lower than their sale prices. To get to a ratio of 100% accuracy, we can calculate what an increase would be by taking (100%-90%) ÷ 90% = 10% ÷ 90% = 11%. This means that property assessments meeting a ratio of 90% could achieve a ratio of 100% if their assessments increased 11%.
We will use two sources to base our estimated AV increases for class 2 (Residential), class 3 (Multi-family), and class 5 (Commercial) properties. Class 2 and class 3 ratios come from the Illinois Department of Revenue, specifically IDOR 2023 Ratios, Cook County District 2 (note that IDOR ratios are “assessment ratios” and need to be converted to sales ratios in order to derive the estimated assessment increase. This is calculated by dividing the assessment ratio by the property class’s level of assessment, which in case of classes 2 and 3 is 10%). Class 5 ratios are taken from the Cook County Commercial Valuation Study.
Converting ratio statistics to anticipated AV growth
We’ll define these ratios, convert the assessment ratios to sales ratios, and then derive the anticipated increase to assessed values. Eventually we’ll apply these increases to each PIN based on that PIN’s major class.
# Define class 2, 3 and 5 ratios which are taken from the reports cited above
class_2_assessment_ratio <- .081
class_3_assessment_ratio <- .0594
class_5_sale_ratio <- .7179

est_increases <- data.frame(
  class = c("2", "3", "5"),
  ratio =
    c(class_2_assessment_ratio, class_3_assessment_ratio, class_5_sale_ratio)
) %>%
  mutate(
    fmv_ratio = ifelse(stringr::str_sub(class, 1, 1) == "5", ratio,
      ratio / .1
    ),
    est_increase = round((1 - fmv_ratio) / fmv_ratio, 4)
  )
The table below shows the estimated increase in assessed values for each major class. For example, class 2 properties are estimated to increase by 23.5% to achieve a sales ratio of 100% accuracy.
Gathering PINs, exemptions, TIF and agency data
We’ve already queried the CCAO Open Data PIN Universe to gather all North tri tax codes from 2012 to 2023, but we’ll need to query that open data asset again to bring in all North tri PINs that existed in tax year 2023. We then will query the PTAXSIM data base to join information about each PIN’s assessed value, the class code, and any exemptions that the PIN qualified for in Tax Year 2023. For this analysis we’ll assume that the exemptions received in 2023 will remain in place through Tax Year 2025.
# Query the CCAO Open Data PIN Universe to get all North tri PINs for
# tax year 2023
north_tri_pins <- GET(
  base_url,
  query = list(
    year = 2023,
    triad_code = "2",
    `$select` = "pin, tax_code",
    `$limit` = 500000L
  )
)

north_tri_pins <- fromJSON(rawToChar(north_tri_pins$content))

# The lookup_pin function queries the PTAXSIM database for all info related to
# the PIN's AV, EAV and exemptions
north_tri_pins_exemptions <- lookup_pin(
  2023,
  north_tri_pins$pin
)

# Join the data with AV and exemption info to our other data.frame with PINs
# and tax codes
north_tri_pins <- north_tri_pins_exemptions %>%
  left_join(north_tri_pins, by = "pin") %>%
  mutate(
    exe_total = rowSums(across(starts_with("exe_"))),
    major_class_code = substr(class, 1, 1)
  )
Next, we’ll query the PTAXSIM database to collect data on all taxing agencies and TIFs within the North tri. To calculate a tax code’s tax rate, we need to calculate the individual tax rates of each agency that covers that tax code.
# We'll need to use the North tri tax codes in our TIF and agency queries,
# so let's filter our existing north_tri_tax_codes dataframe to just include
# tax codes that existed in 2023
north_tri_tax_codes <- north_tri_tax_codes %>%
  filter(year == 2023)

# Query TIF distributions by tax code
north_tri_tif_dists <- dbGetQuery(
  ptaxsim_db_conn,
  glue_sql("
           SELECT *
           FROM tif_distribution
           WHERE year = 2023
           AND tax_code_num IN ({north_tri_tax_codes$tax_code*})",
    .con = ptaxsim_db_conn
  )
)
# Query all active North tri agencies from Tax Year 2023
north_tri_agencies <- lookup_agency(
  2023,
  as.character(north_tri_tax_codes$tax_code)
) %>%
  filter(agency_total_ext > 0)
Applying the estimated increase
Next, we need to calculate added_tax_code_eav, the total
EAV being added to each tax code based on the above estimates.
We’ll first apply est_increases to each PIN in our list of
north_tri_pins based on its major class. This grows EAV,
which grows the tax base.
But there are property tax provisions that reduce or freeze taxable value in a way that reduces this tax base growth. Below are the exceptions that the tax rate calculations need to handle:
- If a PIN received any exemptions except for the Senior Freeze, its taxable value is its EAV with the increase applied, minus all applicable exemption amounts.
- If a PIN did receive the Senior Freeze exemption, then the increase is not applied, since the frozen taxable EAV should be exactly the same as the EAV at the time when the exemption first went into effect (the “base year” EAV). If a PIN received any other exemptions, those exemptions are subtracted from the base year EAV.
- If a tax code is within a TIF district, its aggregate EAV cannot exceed that tax code’s frozen EAV as set when the TIF was created.
The code below shows how this is accomplished. It culminates in the
key variable we’ll use in our estimation of the future tax base,
added_tax_code_eav, which is the difference between the
reconstructed base year (2023) EAV and the estimated 2025 EAV.
# Join projected EAV increase by class to base year north tri PINs
# Apply percent increases to the base year EAV
est_eav_tax_code <- north_tri_pins %>%
  left_join(est_increases, by = c("major_class_code" = "class")) %>%
  mutate(
    est_increase = replace_na(est_increase, 0),
    # Estimated increase is applied to total EAV, prior to removing exemptions
    est_eav = round(eav * (1 + est_increase)),
    # For PINs w/ senior freeze exemptions, their taxable EAV is calculated
    # with base year EAV minus total exemptions, as the senior freeze exemption
    # amount is contingent on the base year EAV. For these PINs, their taxable
    # EAV will remain the frozen EAV amount, minus any other exemptions they
    # may have.
    taxable_frozen_eav = ifelse(
      exe_freeze > 0,
      eav - exe_total,
      NA
    ),
    # If PIN has senior freeze, future taxable EAV will be frozen EAV (minus
    # any other exemptions), otherwise, the projected EAV minus exemptions
    est_taxable_eav = if_else(
      exe_freeze > 0,
      taxable_frozen_eav,
      est_eav - exe_total
    ),
    base_year_taxable_eav =
      eav - exe_total
  ) %>%
  group_by(tax_code) %>%
  summarise(
    base_year_taxable_eav = sum(base_year_taxable_eav),
    est_taxable_eav = sum(est_taxable_eav)
  ) %>%
  left_join(north_tri_tif_dists %>%
    select(
      tax_code = tax_code_num,
      tax_code_frozen_eav
    ), by = "tax_code") %>%
  # If tax code is in TIF, keep EAV frozen if the estimated EAV is greater
  # than frozen EAV
  mutate(
    base_year_taxable_eav = case_when(
      tax_code_frozen_eav <= base_year_taxable_eav ~
        tax_code_frozen_eav,
      TRUE ~ base_year_taxable_eav
    ),
    est_taxable_eav = case_when(
      tax_code_frozen_eav <= est_taxable_eav ~
        tax_code_frozen_eav,
      TRUE ~ est_taxable_eav
    ),
    added_tax_code_eav = est_taxable_eav - base_year_taxable_eav
  )
Next, we take the growth to the tax code EAV,
added_tax_code_eav and add that on to the base year EAV of
each agency that falls within that tax code as reported by the Cook
County Clerk. This ensures that our 2025 estimated agency EAV will
include the base year EAV from PINs that are not within the North
tri.
To illustrate, if we aggregate PIN-level EAVs to calculate the base for the taxing agency of Cook County with only the North tri PINs, we’d be missing a significant portion of that agency’s base. In order to estimate a tax base that represents the entire agency, but also incorporates the anticipated increased EAV for the North tri, we need to use the clerk’s reported base year EAV and add the estimated growth to that amount.
# Sum the calculated base and projected EAV to agency level, these amounts will
# be used in Excel WB to calculate agency tax rates
agencies_new_eav <- north_tri_agencies %>%
  filter(year == 2023) %>%
  left_join(est_eav_tax_code, by = "tax_code") %>%
  group_by(agency_name, agency_num, agency_major_type) %>%
  summarise(
    agency_total_ext = first(agency_total_ext),
    agency_base_year_eav_clerk = first(as.numeric(agency_total_eav)),
    # Sum base year EAV to answer question,
    # how off are we from clerk's reported EAV by agency?
    agency_base_year_eav_calc = sum(base_year_taxable_eav),
    added_agency_eav = sum(added_tax_code_eav)
  )
Calculating the estimated tax rates
Finally, we apply an estimated levy increase to each agency’s total 2023 extension. Then we can divide each agency’s estimated 2025 extension by the estimated tax base to get that agency’s tax rate. We then sum the agency tax rates by tax code to derive an aggregate tax code rate. A tax code rate represents the final tax rate that a property owner will pay, and is the sum of all agency rates that fall within that property’s tax code.
# Define anticipated agency levy growth from 2023 to 2025
# We assume a 4% yoy growth for agency levies, meaning an approximate
# 8% growth for 2023-2025
levy_perc_growth <- .08

# Calculate the agency tax rates, calculating new base by adding
# "added_agency_eav" to the "agency_base_year_eav_clerk" in order
# to account for non-north tri portions of the base
agency_rates <- agencies_new_eav %>%
  mutate(
    est_agency_ext_25 = agency_total_ext * (1 + levy_perc_growth),
    est_agency_eav_25 = agency_base_year_eav_clerk + added_agency_eav,
    est_agency_rate_25 = est_agency_ext_25 / est_agency_eav_25,
    act_agency_rate_23 = agency_total_ext / agency_base_year_eav_clerk
  ) %>%
  left_join(
    north_tri_agencies %>%
      filter(year == 2023) %>%
      select(
        tax_code, agency_num,
        agency_minor_type
      ),
    by = "agency_num"
  ) %>%
  select(
    tax_code,
    agency_num,
    agency_name,
    agency_major_type,
    agency_minor_type,
    act_agency_ext_23 = agency_total_ext,
    act_agency_eav_23 = agency_base_year_eav_clerk,
    est_agency_ext_25,
    est_agency_eav_25,
    act_agency_rate_23,
    est_agency_rate_25
  )

tax_code_rates <- agency_rates %>%
  group_by(tax_code) %>%
  summarise(
    tax_code_rate_2023 = sum(act_agency_rate_23),
    estimated_tax_code_rate_2025 = sum(est_agency_rate_25)
  )
Summarizing the results
As anticipated, the estimated increase in assessed values for the North tri leads to lower tax rates across all tax codes. The median estimated tax rate for 2025 is 7.76%, which is a -1.32% difference from the 2023 median tax rate of 9.08%.
The table below shows each township’s median 2023 Tax Rate and the median Estimated 2025 Tax Rate.
All tax code tax rates for the North tri can be viewed and exported with the table below.