
Introduction
One of the unique features of PTAXSIM is the database that accompanies the package - this DB contains the only publicly accessible, machine-readable data collected from the various Cook County property tax agencies going back to 2006. While the primary use of PTAXSIM is its functionality to calculate tax bills, its database holds a plethora of data that can be used to investigate Cook County’s property tax system, including the behavior of the over 900 taxing agencies and 400 TIFs that collect revenue through property taxes.
In this vignette, we’ll demonstrate how to query data from the PTAXSIM SQLite database that can help us analyze taxing agencies’ property tax revenue over time.
Additionally, we’ll show how to account for the 2024 changes to the Cook County Clerk’s agency data structure, which is necessary when conducting a time series analysis of taxing agencies before and after 2024.
Chicago taxing agencies
Using data from the PTAXSIM database, let’s look at the levy history
for three of the primary taxing agencies that appear on a Chicago
property’s tax bill: the CITY OF CHICAGO,
BOARD OF EDUCATION (a.k.a. Chicago Public Schools), and
CHICAGO PARK DISTRICT.
First, load some useful libraries and instantiate a PTAXSIM DBI
connection with the variable name ptaxsim_db_conn.
library(data.table)
library(dplyr)
library(DT)
library(here)
library(ggplot2)
library(ptaxsim)
library(stringr)
library(tidyr)

ptaxsim_db_conn <- DBI::dbConnect(RSQLite::SQLite(), here("./ptaxsim.db"))
Accounting for 2024 changes to agency fund reporting
In 2024, the Clerk switched to reporting 78 agencies as funds underneath a separate agency. These agencies had always represented funds in the real world, but the Clerk reported them as independent taxing agencies prior to 2024. We need to account for this change when analyzing agencies and funds over time.
The following types of funds were affected by this change:
- Library funds
- General assistance funds
- Infrastructure funds (road and bridge)
- Mental health and public health funds
Most tax codes contain at least one of these types of agencies.
Using the agency crosswalk
Before we query the relevant agency data for our analysis, we first
will need to check if any of the agencies of interest changed to funds
in 2024. To do this, we can query the agency_crosswalk
table:
agency_crosswalk <- DBI::dbGetQuery(
  ptaxsim_db_conn,
  "
  SELECT agency_num, agency_num_final
  FROM agency_crosswalk
  "
)

datatable(agency_crosswalk)
The crosswalk contains the following columns:
-
year_of_change: The year that the agency changed- This is not relevant to our analysis, so we exclude it from our query; however, it may be useful for other types of analysis
-
agency_num: The agency number prior to the change, when the fund was reported as an independent agency -
agency_num_final: The agency number after the change, representing the agency under which the fund is now reported
Note that the user can still see details about these former agencies,
now funds, by querying the agency_fund and
agency_fund_info tables. Let’s join the agency crosswalk to
agency_fund_info to confirm that the
CITY OF CHICAGO LIBRARY FUND was previously defined as an
independent agency and has now been folded into the
CITY OF CHICAGO agency:
agency_info <- DBI::dbGetQuery(
  ptaxsim_db_conn,
  "
  SELECT agency_num, agency_name
  FROM agency_info
  "
)

agency_crosswalk_info <- agency_crosswalk %>%
  left_join(
    agency_info,
    by = c("agency_num" = "agency_num")
  ) %>%
  rename(agency_name_prev = agency_name) %>%
  left_join(
    agency_info,
    by = c("agency_num_final" = "agency_num")
  ) %>%
  rename(agency_name_final = agency_name) %>%
  rename(agency_num_prev = agency_num) %>%
  select(
    agency_num_prev, agency_name_prev,
    agency_num_final, agency_name_final
  )

agency_crosswalk_info %>%
  filter(str_detect(agency_name_prev, "CITY OF CHICAGO LIBRARY FUND")) %>%
  datatable()
Now let’s see how to use this crosswalk to track Chicago agencies over time.
Tracking Chicago taxing agencies over time
Let’s start by filtering agency_info to find the agency
numbers for Chicago taxing agencies1 so that we can track them over time. We’ll
assume that the precise names of these agencies are already known, but
you can browse agency_info.agency_name to find the names of
agencies that interest you if you don’t know them.
chi_agency_info <- agency_info %>%
  filter(
    agency_name %in% c(
      "CITY OF CHICAGO",
      "CITY OF CHICAGO LIBRARY FUND",
      "BOARD OF EDUCATION",
      "CHICAGO PARK DISTRICT"
    )
  )

datatable(chi_agency_info)
Now that we have the agency numbers for the agencies we are
interested in, we’ll use them to extract levies and extensions2 from the
agency table:
agency <- DBI::dbGetQuery(
  ptaxsim_db_conn,
  "
  SELECT *
  FROM agency
  "
)

chi_agencies_raw <- chi_agency_info %>%
  left_join(agency, by = "agency_num")

chi_agencies_raw %>%
  select(year, agency_num, agency_name, total_final_levy, total_ext) %>%
  datatable()
Before we do anything with these levies and extensions, we need to
fold the CITY OF CHICAGO LIBRARY FUND into the
CITY OF CHICAGO levy total for all years prior to 2024. We
can do this using the agency crosswalk and a simple summation:
chi_agencies <- chi_agencies_raw %>%
  # Join the agency crosswalk to get the parent agency number for pre-2024 years
  left_join(agency_crosswalk, "agency_num") %>%
  # For the agencies that did have an agency number change in 2024, replace the
  # old agency_num with the new one
  mutate(agency_num = coalesce(agency_num_final, agency_num)) %>%
  group_by(year, agency_num) %>%
  summarize(
    total_final_levy = sum(total_final_levy),
    total_ext = sum(total_ext)
  )
Tracking Chicago, CPS, and CPKD levies
Now that we have the correct total levies for the City of Chicago, Chicago Public Schools and Chicago Park District across all years, we can look at how those levies have changed from 2006 to 2024.
CPS and CPKD are both subject to PTELL (Property Tax Extension Law Limit), which ensures certain taxing agencies do not increase their levies beyond the rate of inflation (with some exceptions3). The City of Chicago is not by virtue of being a non-home rule agency. However, the City of Chicago imposes its own limits which mirror PTELL’s and prohibit a taxing agency from increasing its levy more than the rate of inflation or 5%, whichever is less.
To do so, we’ll calculate the rate at which the levies have grown
compared to the CPI-U.
Fortunately CPI data, as reported by the Illinois Department of Revenue
(IDOR) for purpose of PTELL calculations, is available in the PTAXSIM
data base in the cpi table.
# Calculate the levy percent change for each agency indexed to 2006
chi_levy_indx <- chi_agencies %>%
  group_by(agency_num) %>%
  mutate(
    levy_2006 = total_final_levy[year == 2006][1],
    levy_pct_inc = (total_final_levy - levy_2006) / levy_2006 * 100
  ) %>%
  ungroup() %>%
  select(agency_num, year, levy_pct_inc) %>%
  pivot_longer(
    cols = levy_pct_inc,
    names_to = "series",
    values_to = "pct_inc"
  )

# Query CPI data from PTAXSIM db, calculate percent change indexed to 2006
cpi <- DBI::dbGetQuery(
  ptaxsim_db_conn,
  "
  SELECT *
  FROM cpi
  "
) %>%
  mutate(
    pct_inc = (cpi / cpi[year == 2006] - 1) * 100,
    agency_num = "100",
    series = "cpi"
  ) %>%
  filter(year >= 2006) %>%
  select(year, agency_num, series, pct_inc)
We’ll then plot the rate of change for each levy compared to inflation.
Click here to show plot code
highlight_key <- tibble(
  agency_num = c("100", "050200000", "030210000", "044060000"),
  label      = c("CPI-U", "CPKD", "City", "CPS")
)

plot_1_df <- rbind(cpi, chi_levy_indx) %>%
  left_join(highlight_key, by = "agency_num")

df_lab <- plot_1_df %>%
  group_by(agency_num, label) %>%
  filter(year == max(year, na.rm = TRUE)) %>%
  slice_tail(n = 1) %>%
  ungroup() %>%
  mutate(label_col = ifelse(label == "CPI-U", "#d62728", "black"))

chi_levy_plot_1 <-
  ggplot() +
  geom_line(
    data = plot_1_df,
    aes(x = year, y = pct_inc / 100, group = agency_num, color = label),
    linewidth = .5
  ) +
  # right-side labels in black (no color mapping)
  geom_text(
    data = df_lab,
    aes(x = year, y = pct_inc / 100, label = label),
    color = df_lab$label_col,
    hjust = -0.1,
    size = 3.5
  ) +
  scale_y_continuous(labels = scales::percent_format(accuracy = 1)) +
  scale_x_continuous(
    breaks = seq(min(plot_1_df$year, na.rm = TRUE),
      max(plot_1_df$year, na.rm = TRUE),
      by = 2
    ),
    expand = expansion(mult = c(0.01, 0.08)) # add right padding so labels fit
  ) +
  scale_color_manual(
    values = c(
      "CPKD"   = "black",
      "City"   = "black",
      "CPS"    = "black",
      "CPI-U"  = "#d62728"
    ),
    breaks = c("CPKD", "City", "CPS"),
    guide = "none" # hide legend since lines are labeled
  ) +
  labs(
    x = "Year",
    y = "Percent change from 2006",
  ) +
  theme_minimal(base_size = 12)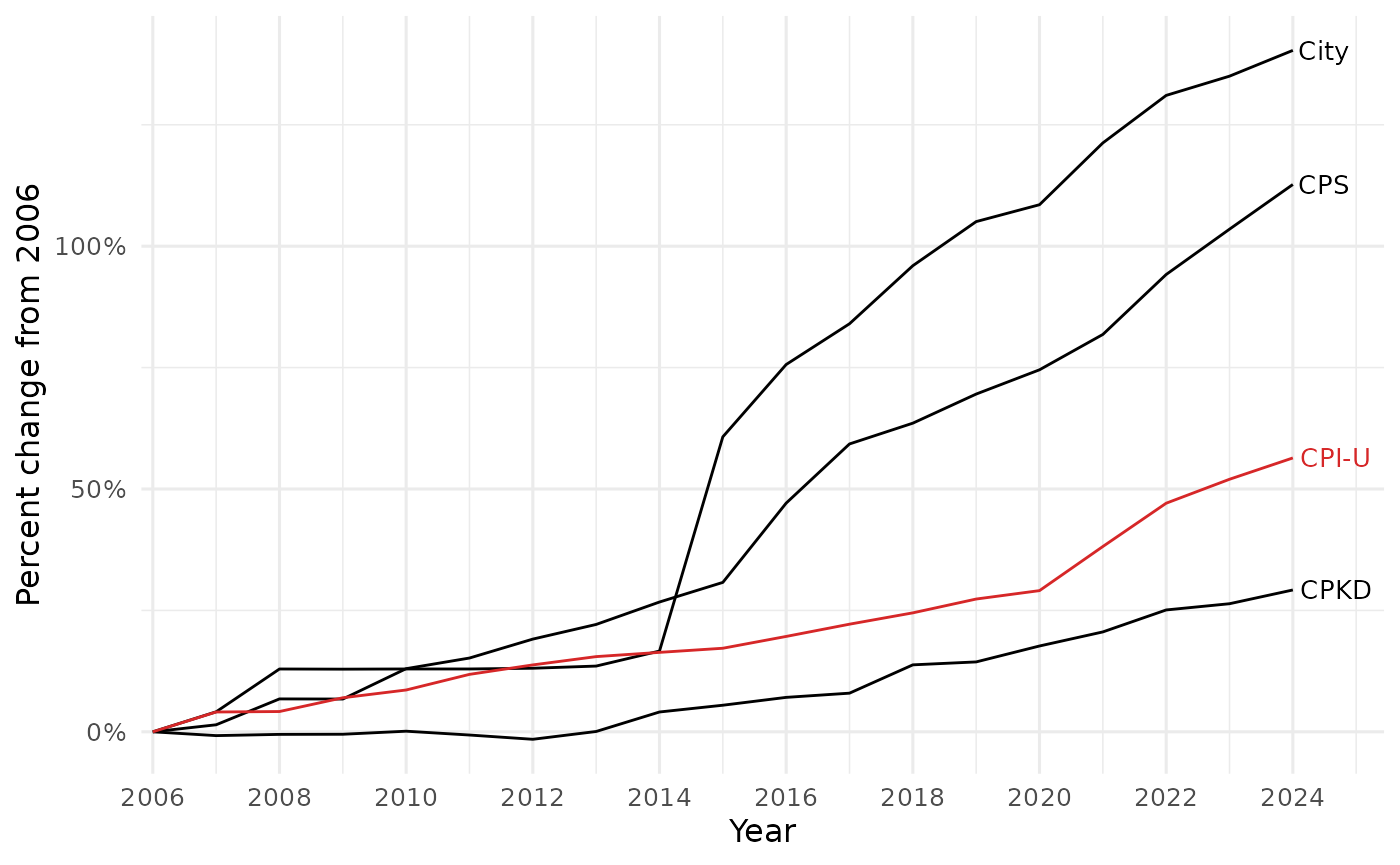
We can see that the City of Chicago’s levy has increased the most, having more than doubled from 2006 to 2024. Both Chicago and CPS’s levies have increased far beyond the rate of inflation.
Even though the City’s levy has increased the most in percentage terms since 2006, it does not have the largest levy. The taxing agencies that rely most on property taxes are school districts and this is true for Chicago as well. The plot below shows the final tax extensions (meaning the final amount to be received by taxing agencies after the levies are validated by PTELL), for each of the three agencies. CPS is slightly more than double the City’s extension in 2024 at about $4 billion. Chicago Park District’s extension is substantially less at around $300 million.
Click here to show plot code
plot_2_df <- chi_agencies %>%
  left_join(highlight_key)

df_lab <- plot_2_df %>%
  group_by(agency_num, label) %>%
  slice_max(year, n = 1, with_ties = FALSE) %>%
  ungroup()

df_2024 <- plot_2_df %>%
  filter(year == 2024) %>%
  group_by(agency_num, label) %>%
  slice_tail(n = 1) %>% # in case there are duplicates in 2024
  ungroup() %>%
  mutate(label_2024 = paste0(
    label, ": ",
    scales::label_dollar(scale = 1e-9, suffix = "B", accuracy = 0.1)(total_ext)
  ))

chi_levy_plot_2 <- ggplot(plot_2_df, aes(year, total_ext, group = agency_num)) +
  geom_line(linewidth = 0.5, color = "black") +
  # 2024 value labels like "CPS: $1.1B"
  geom_text(
    data = df_2024,
    aes(label = label_2024),
    color = "black",
    hjust = .6,
    vjust = -.5
  ) +
  scale_y_continuous(labels = scales::label_dollar(
    scale = 1e-9,
    suffix = "B"
  )) +
  scale_x_continuous(
    breaks = seq(min(plot_2_df$year, na.rm = TRUE),
      max(plot_2_df$year, na.rm = TRUE),
      by = 2
    ),
    expand = expansion(mult = c(0.01, 0.08))
  ) +
  labs(x = "Year", y = "Final Agency Extension") +
  theme_minimal(base_size = 12)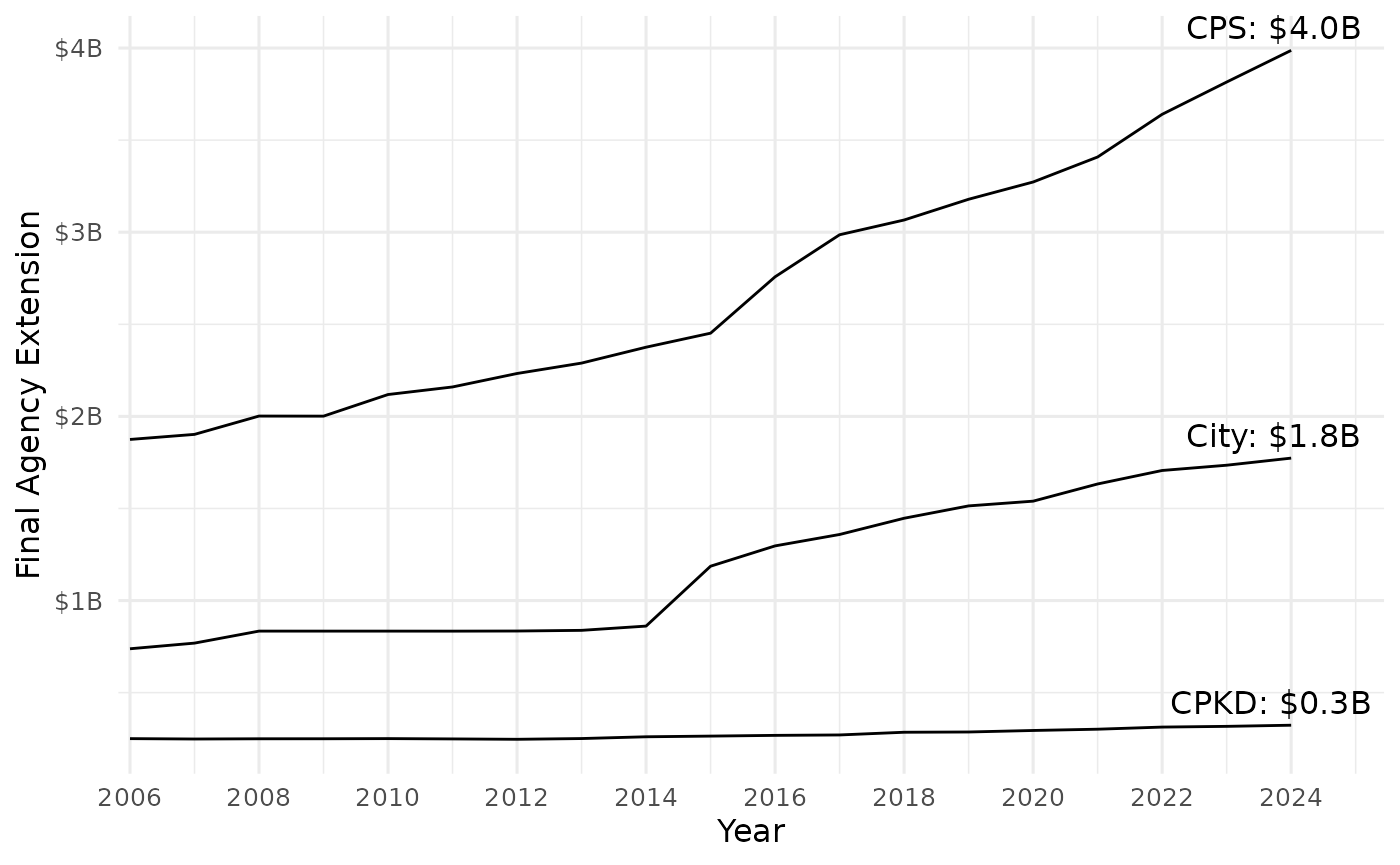
Tracking specific fund revenue over time
The PTAXSIM database also contains information related to taxing
agency’s property tax funds so we can understand in greater detail what
they intend to spend their property tax revenue on. This information can
be found in the agency_fund and
agency_fund_info tables. This data is not utilized by any
of PTAXSIM’s functions, but it is available to be queried and
analyzed.
To demonstrate working with the agency fund data, we will query the
fund information for the CITY OF CHICAGO and the
CITY OF CHICAGO LIBRARY FUND.
The level of detail provided in fund_name varies across
years and agencies which can make analysis or plotting the data tricky.
To simplify agency_fund data further, we opted below to add
broader categories to define funds. In this case, we’ll tag any fund
with “A & B” (Annuities and Benefits) in the name as a pension fund.
We’ll label funds related to bond and interest payments, as well as note
redemption, as “Bond Payments”.
chi_agency_fund_raw <- DBI::dbGetQuery(
  ptaxsim_db_conn,
  "
  SELECT *
  FROM agency_fund
  WHERE agency_num = '030210000'
  OR agency_num = '030210001'
  "
)

chi_agency_fund_info_raw <- DBI::dbGetQuery(
  ptaxsim_db_conn,
  "
  SELECT *
  FROM agency_fund_info
  WHERE agency_num = '030210000'
  OR agency_num = '030210001'
  "
)

chi_agency_fund <- chi_agency_fund_raw %>%
  left_join(chi_agency_fund_info_raw) %>%
  # Remove funds that levy equal to 0
  filter(
    final_levy > 0,
    # Remove fund that only existed in 2006
    fund_type_num != "319"
  ) %>%
  mutate(
    fund_catg =
      case_when(
        grepl("A & B", fund_name) ~ "Pension",
        grepl("NOTE REDEMPTION & INTEREST FUND", fund_name) ~
          "Bond Payments",
        grepl("BONDS & INTEREST", fund_name) ~ "Bond Payments",
        grepl("LIBRARY NOTE REDEMPTION", fund_name) ~ "Library Fund",
        grepl("BONDS & INTEREST", fund_type_name) ~ "Bond Payments",
        grepl("LIBRARY NOTE REDEMPTION", fund_type_name) ~ "Library Fund",
        TRUE ~ fund_type_name
      )
  ) %>%
  group_by(year, fund_catg) %>%
  summarise(
    final_levy = sum(final_levy),
    final_rate = sum(final_rate)
  )
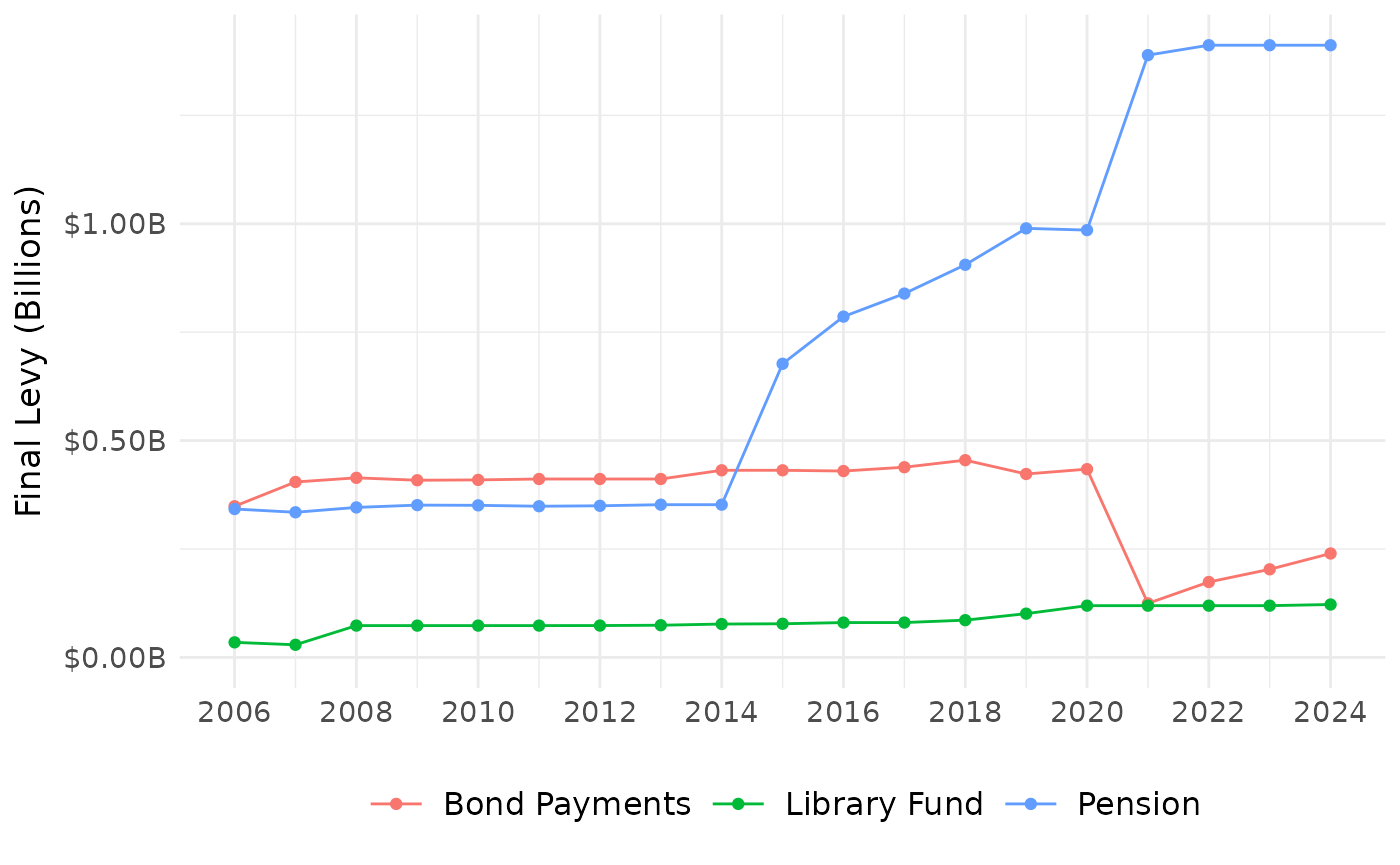
The plot below illustrates how the City’s levy increase in 2016 was driven by a massive increase in the City’s pension contributions. Pension contributions grew again in 2021, but in tandem with a decrease in bond financing.
Click here to show plot code
chi_levy_plot_3 <- chi_agency_fund %>%
  ggplot() +
  geom_line(aes(x = year, y = final_levy, color = fund_catg),
    linewidth = .5
  ) +
  geom_point(aes(x = year, y = final_levy, color = fund_catg)) +
  scale_x_continuous(n.breaks = 10) +
  scale_y_continuous(
    labels = scales::label_dollar(scale = 1e-9, suffix = "B"),
    limits = c(0, NA)
  ) +
  labs(
    x = NULL,
    y = "Final Levy (Billions)",
    color = NULL
  ) +
  theme_minimal() +
  theme(
    axis.title = element_text(size = 13),
    axis.title.y = element_text(margin = margin(r = 6)),
    axis.text = element_text(size = 11),
    strip.text = element_text(size = 16),
    strip.background = element_rect(fill = "#c9c9c9"),
    legend.title = element_text(size = 14),
    legend.key.size = unit(24, "points"),
    legend.text = element_text(size = 12),
    legend.position = "bottom"
  )
With so much of the City’s property tax revenue going to funding pensions, it’s difficult to see if or how there was any change to the amount going to the Library Fund. The below tables show the final levy for each fund type in 2020-2024, as well as the share of the total levy for each fund type by year.
We can also break down the total levy by share allocated to each fund. While the City’s property tax levy has grown each year, the portion allocated to the Library Fund has remained steady.
Using the fund crosswalk to track funds over time
The PTAXSIM database includes a table called
agency_fund_crosswalk that allows you to track specific
funds over time, similar to agency_crosswalk. If you know
the specific agency and fund numbers that you want to analyze, you can
use this crosswalk to handle the 2024 change that turned some agencies
into funds.
As an example, let’s look at the City of Chicago Library Fund again.
We know that the agency number for this fund prior to 2024 was
030210001. Let’s look at the pension fund specifically:
chi_library_pension_fund_num <- chi_agency_fund_raw %>%
  filter(agency_num == "030210001") %>%
  select(year, agency_num, fund_num) %>%
  left_join(chi_agency_fund_info_raw, by = c("agency_num", "fund_num")) %>%
  filter(str_detect(fund_name, "A & B")) %>%
  select(year, agency_num, fund_num, fund_name)

datatable(
  chi_library_pension_fund_num,
  options = list(pageLength = nrow(chi_library_pension_fund_num))
)
This table shows us that the fund number for the library pension fund
was 128000 prior to 2024.
Let’s use the agency fund crosswalk to handle the Clerk’s 2024 change
that switched from reporting the City of Chicago Library Fund as an
independent agency to reporting it as a fund. We can query the agency
fund crosswalk to see that it looks quite similar to
agency_crosswalk:
agency_fund_crosswalk <- DBI::dbGetQuery(
  ptaxsim_db_conn,
  "
  SELECT agency_num, agency_num_final, fund_num, fund_num_final
  FROM agency_fund_crosswalk
  "
)

datatable(agency_fund_crosswalk)
The crosswalk contains the following columns, similar to
agency_crosswalk:
-
year_of_change: The year that the fund changed- This is not relevant to our analysis, so we exclude it from our query; however, it may be useful for other types of analysis
-
agency_num: The agency number prior to the change, when the fund was reported as an independent agency -
agency_num_final: The agency number after the change, representing the agency under which the fund is now reported -
fund_num: The fund number prior to the change -
fund_num_final: The fund number after the change
Using the agency fund crosswalk, we can find the final fund number for the pension fund:
chi_library_pension_agency_fund_crosswalk <- agency_fund_crosswalk %>%
  filter(agency_num == "030210001", fund_num == "128000")

datatable(chi_library_pension_agency_fund_crosswalk)
Then, we can track the pension fund across all years using its post-2024 agency and fund number. Note the change to the agency and fund numbers in 2024:
chi_library_pension_fund <- chi_agency_fund_raw %>%
  # Left join to the full agency fund crosswalk by `agency_num` in order to
  # resolve the final agency/fund numbers for all funds
  left_join(agency_fund_crosswalk, by = c("agency_num", "fund_num")) %>%
  mutate(
    # In most use cases, it makes more sense to resolve the final agency number
    # to the `agency_num` column. However, for the purposes of this demo, we
    # want to show the original agency numbers, so we resolve the final number
    # to `agency_num_final` instead
    agency_num_final = coalesce(agency_num_final, agency_num),
    fund_num_final = coalesce(fund_num_final, fund_num)
  ) %>%
  # Inner join to the version of the agency fund crosswalk that only contains
  # the CPL pension fund so that we can filter for only that fund
  inner_join(
    chi_library_pension_agency_fund_crosswalk %>%
      select(agency_num_final, fund_num_final),
    by = c("agency_num_final", "fund_num_final")
  ) %>%
  select(year, agency_num, fund_num, final_levy) %>%
  arrange(year)

datatable(
  chi_library_pension_fund,
  options = list(pageLength = nrow(chi_library_pension_fund))
)
Here’s a chart showing the same data:
Click here to show plot code
chi_library_pension_fund_plot <- chi_library_pension_fund %>%
  ggplot(aes(x = as.integer(year), y = final_levy)) +
  geom_line(linewidth = 0.5, color = "black") +
  geom_point(color = "black") +
  scale_x_continuous(n.breaks = 10) +
  scale_y_continuous(
    labels = scales::label_dollar(scale = 1e-6, suffix = "M"),
    limits = c(5e6, NA)
  ) +
  labs(
    x = NULL,
    y = "Final Levy (Millions)"
  ) +
  theme_minimal(base_size = 12)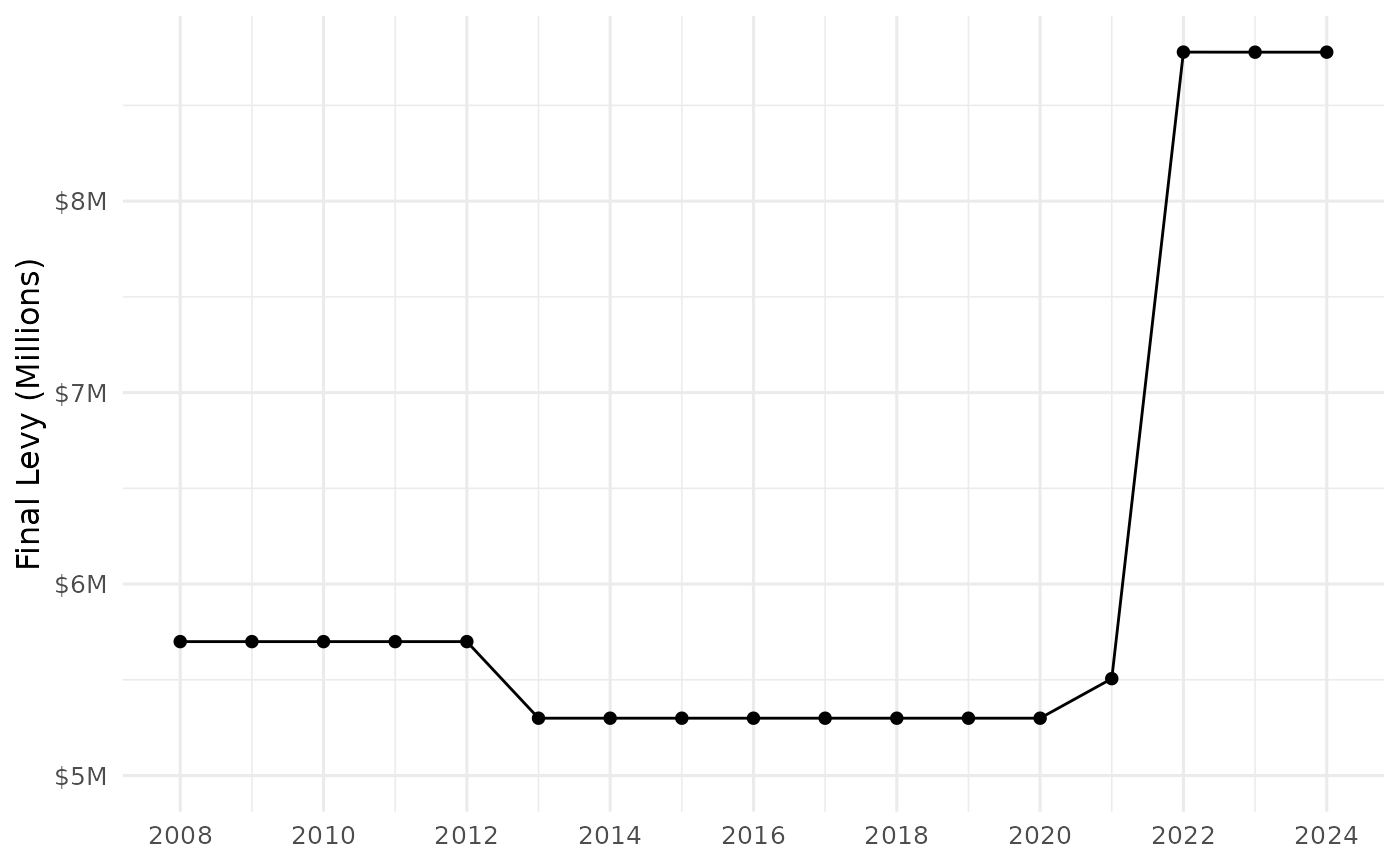
Caveat: Levy adjustment funds require special handling
The code above that uses the fund crosswalk to track funds over time
should work for nearly all types of funds, but there is one exception:
levy adjustment funds. These funds show the amount that
an agency recaptures in a given year, and they always have fund number
408000.
When the Clerk switched to reporting some agencies as funds in 2024, they consolidated 2024 levy adjustments for those funds into the levy adjustment fund that applies to the parent agency as a whole. For example, in 2023, the township of Berwyn had levy adjustments for three funds that the Clerk reported as independent agencies:
berwyn_agency_fund <- DBI::dbGetQuery(
  ptaxsim_db_conn,
  "
  SELECT *
  FROM agency_fund
  wHERE agency_num LIKE '02002000%'
  "
)

berwyn_agency_info <- DBI::dbGetQuery(
  ptaxsim_db_conn,
  "
  SELECT *
  FROM agency_info
  WHERE agency_num LIKE '02002000%'
  "
)

berwyn_agency_fund_info <- DBI::dbGetQuery(
  ptaxsim_db_conn,
  "
  SELECT *
  FROM agency_fund_info
  WHERE agency_num LIKE '02002000%'
  "
)

berwyn_agency_fund_levy_adj <- berwyn_agency_fund %>%
  left_join(
    berwyn_agency_info %>%
      select(agency_num, agency_name),
    by = "agency_num"
  ) %>%
  left_join(
    berwyn_agency_fund_info %>%
      select(agency_num, fund_num, fund_type_num, fund_name),
    by = c("agency_num", "fund_num")
  ) %>%
  filter(fund_type_num == "408") %>%
  arrange(agency_num) %>%
  select(year, agency_num, agency_name, fund_num, fund_name, levy)

berwyn_agency_fund_levy_adj %>%
  filter(year == 2023) %>%
  datatable() %>%
  formatCurrency(
    columns = c("levy"),
    currency = "$",
    digits = 0
  )
However, in 2024, there was only one levy adjustment fund for the entirety of the town of Berwyn:
berwyn_agency_fund_levy_adj %>%
  filter(year == 2024) %>%
  datatable() %>%
  formatCurrency(
    columns = c("levy"),
    currency = "$",
    digits = 0
  )
Since the Clerk no longer reports levy adjustments for individual funds that it used to report as agencies, it’s not possible to analyze levy adjustments at the fund level starting in 2024. Instead, we must analyze levy adjustments at the agency level. This is easy using the fund crosswalk, but we need to take care to sum together the per-fund levy adjustments prior to 2024:
berwyn_levy_adj <- berwyn_agency_fund_levy_adj %>%
  left_join(agency_fund_crosswalk, by = c("agency_num", "fund_num")) %>%
  mutate(
    agency_num = coalesce(agency_num_final, agency_num),
    fund_num = coalesce(fund_num_final, fund_num)
  ) %>%
  group_by(year, agency_num, fund_num) %>%
  summarize(levy = sum(levy, na.rm = TRUE))

datatable(berwyn_levy_adj) %>%
  formatCurrency(
    columns = c("levy"),
    currency = "$",
    digits = 0
  )
Conclusion
The code provided in this vignette are very simple tutorials on how to query taxing agency data from the PTAXSIM database. We hope access to a free and open data source that aggregates data from multiple disparate sources for the first time enables rigorous analysis of the Cook County property tax system!